Recent Posts
-

CSI is hiring: Office Administrator
The Office Administrator will play a vital role in supporting the smooth
 20 July, 2026
 -
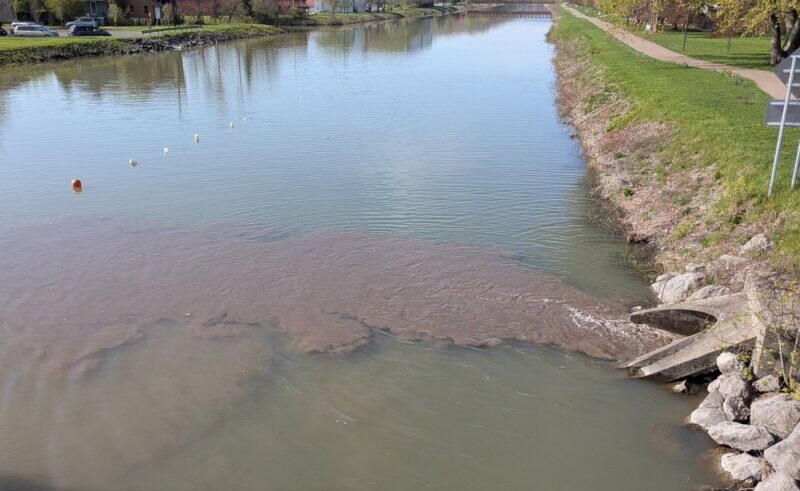
From Community Report to Regulatory Action: How One Cayuga Inlet Observation Triggered a Rapid Scientific Response
CSI’s Outreach & Programs Coordinator, Alyssa Johnson, collects a sample from Cliff
6 May, 2026